Quantcast
Channel: ODTUG Aggregator
Viewing all 1880 articles
Browse latest View live

HFM Command Line Automation @ericerikson @orclEPMblogs @orclEPMblogs

$
0
0
Happy May to everyone. I got the idea for this blog post from a client who wanted to maintain and manage HFM from CA-7 jobs; basically where you do things from a command line on a scheduled basis. HFM isn't really geared for that; but, there is a legendary, mythical way to do pretty much everything!

For versions prior to 11.1.2.4 there is a third party utility called HFM Batch that can be used to do this, but it doesn't work with 11.1.2.4. Fortunately there is a solution - from Oracle and included with HFM - and it goes all the way back to the early, early days of HFM. Some documentation I have on the technique is dated circa 2003.

So, what you do, is .....


ATTEND KSCOPE17!    www.kscope17.com


Seriously, at KScope17 there is a presentation that covers this specific topic (Monday, 10:30am). I don't want to steal Beatrice's thunder, especially since she recently helped me with the topic, but she's going to cover it all then.

And to save $100 when registering, use code 123OLAP - you'll see a field where you can enter this.

Hope to see you in San Antonio!

P.S. Here's a sneak peek:


Intercompany Eliminations in PBCS @HyperionNerd @orclEPMblogs @orclEPMblogs @orclEPMblogs @orclEPMblogs @orclEPMblogs @orclEPMblogs @orclEPMblogs

$
0
0

As part of a recent PBCS implementation, I had to design an Intercompany Elimination solution within a BSO plan type.  This is a relatively uncommon and somewhat complex requirement in a PBCS implementation, and as such, I was pretty excited to blog about it.  Unfortunately, the whole post nearly ended up in the garbage.

Every once in a while, you write a great post, only to find that someone else has covered the topic sooner than you, and better than you.  In my case, that person was Martin Neuliep.  In Developing Essbase Applications:  Hybrid Techniques and Practices, Martin shared a single formula that elegantly calculated Intercompany Eliminations in a BSO cube.  In addition, Martin was scheduled to discuss the topic of eliminations at Kscope in his presentation on June 28th, titled Eliminating the Eliminations Problem in Essbase.

Luckily, I had an ASO solution in addition to my BSO approach.  As it turns out, Martin was planning on sharing several elimination calculation methods in his presentation (some developed by him, and some developed by others).  Perhaps my ASO solution will make the cut?  (hint, hint)  Either way, you should check out his presentation – I will definitely be there.

With all of that said, here’s my approach to intercompany eliminations in an ASO plan type.

Why Eliminate Intercompany Transactions?

Most of my clients create their Budgets and Forecasts in a “fully eliminated” manner.  Within their financial plans, they pretend that certain transactions don’t occur, because these transactions don’t affect the company’s bottom line.  If one subsidiary has a planned (future) transaction with another subsidiary, these clients may not bother recording the transaction in their Budget or Forecast at all.  While this approach simplifies the planning process, it leaves out financial details that may be useful.

When a client’s requirements indicate that these transactions are relevant to the planning process, we need to build Intercompany Elimination logic into our PBCS applications.  The accounting behind these transactions can get pretty complex, but what we’re going to focus on today are the technical mechanics that facilitate these eliminations in PBCS, specifically in an ASO plan type.

So why do we eliminate these transactions?  Because depending on where we’re looking in the Entity dimension, we need to pretend that they never occurred.  As far as most investors are concerned, these intercompany transactions don’t count on a consolidated basis.  Imagine selling a car to your spouse . . . this transaction doesn’t change your combined income or net worth.  This leads us to an interesting question.  When and where do we eliminate these transactions?

The Land of Make Believe

Let’s start with a simple example – an imaginary company that mines raw materials and sells those materials to its manufacturing units.  These plants then sell finished goods to a distribution company.  All of these entities are part of the same vertically integrated company.  The Entity dimension in such a company might looks like this:

Image_1

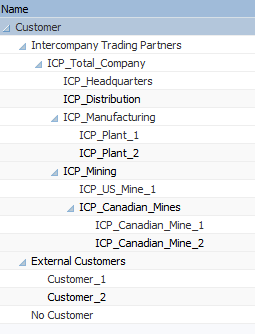
To facilitate transactions between two entities in an OLAP database, it is generally beneficial to have separate Entity and Customer Dimensions.  The only unusual thing about this design is that many of the “Customers” are internal customers.  As such, our Customer dimension might look something like this:

Image_13

Note that all members under Intercompany Trading Partners correspond with a member from the Entity dimension exactly, but with an “ICP_” prefix.  This ASO solution will not work if there are discrepancies between Entity dimension members and the members underneath Intercompany Trading Partners.

Planning Intercompany Transactions

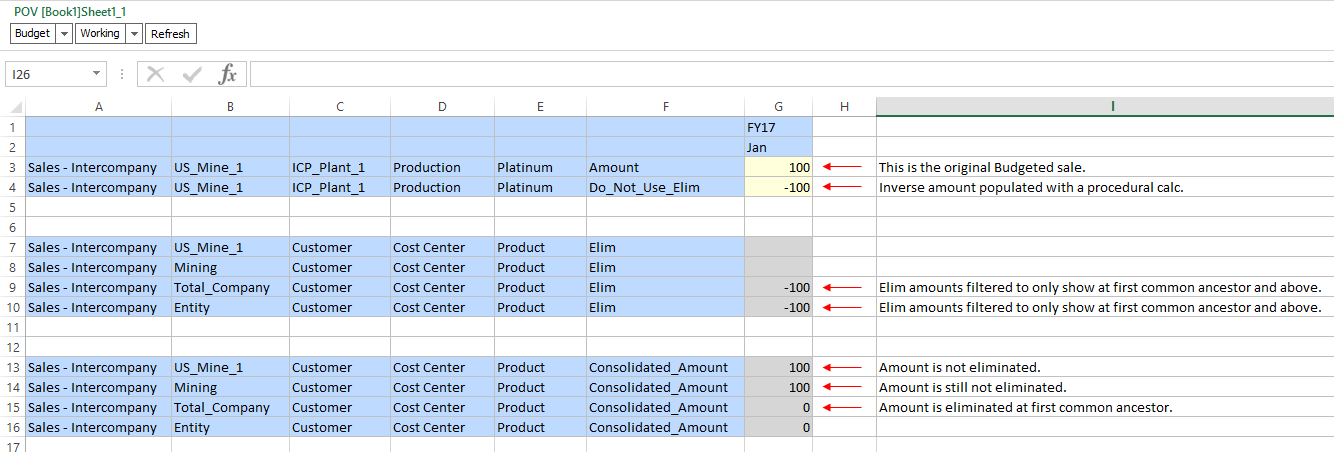
Intercompany transactions can occur across a variety of accounts within the Income Statement and Balance Sheet.  The simplest example is one subsidiary selling something to another subsidiary within the same company.  Let’s assume that US Mine 1 sells something to Plant 1 for $100.  Our level zero data would look something like this in PBCS:

Image_3

If we were to look at Total Sales for US_Mine_1, we would want to see $100 in sales.  But what if we wanted to see Total Sales for Total_Company?  Assuming that this was the only sale, we would want to see $0.  This is because the transaction must be eliminated at the first common ancestor between the Entity and the Intercompany Trading Partner.  Total_Company is the first common ancestor between US_Mine_1 and Plant_1.  What makes this calculation interesting is that the transaction should NOT be eliminated at ancestors before we arrive at the first common ancestor.  So we would definitely expect to see that $100 in sales to show up in the parent member Mining.

The Dreaded “E-Company”

The ins-and-outs of these transactions can get tricky, especially when mixing many transactions together with both internal and external customers.  Developers will likely have multiple sets of accounts being eliminated.  (E.g., Sales & Cost of Sales, Receivables & Payables, etc.)  Ragged hierarchies and alternate hierarchies can add additional complexity.  For this reason, it can be helpful to introduce “E-Companies” into the Entity dimension.  These are basically fake companies where we only calculate and store elimination data.

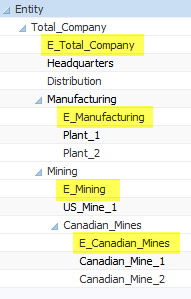
Adding E-Companies to the Entity dimension might look something like this:

Image_4

Unfortunately, E-Companies can make an Entity dimension convoluted.  If your company structure is particularly large or volatile, E-Companies can create a significant amount of maintenance.  They can also be confusing to end-users who might not understand their purpose.

** NOTE– Most intercompany elimination solutions in BSO databases require E-Companies!

ASO to the Rescue!

One of the nice things about PBCS implementations is that they often include an ASO reporting database.  In fact, some clients never consolidate their BSO databases at all, and instead, simply map their data to an ASO cube that rolls everything up on the fly – no business rule required!  And here’s where things get really awesome – in an ASO database, we can calculate intercompany eliminations without the need for E-Companies.

Here are some things to consider when designing your ASO plan type:

  • Both an Entity dimension and a Customer dimension are required.
  • The Intercompany Trading Partner hierarchy (within the Customer dimension) must match the Entity dimension exactly, with the exception of “ICP_” prefixes. This includes intermediate parents.
  • A “Data Source” dimension of some type is required to separate regular data from eliminations.
  • Account dimensions in ASO databases are automatically set to Dynamic. The Data Source dimension will also need to be dynamic to support member formulas.

The Data Source Dimension

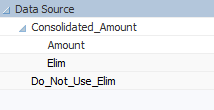
In this solution, all of the logic associated with eliminations lives in a dimension called Data Source (or something similar).  In this dimension, all base (non-eliminated) data is loaded into a member called Amount.

Data_Source

This dimension also includes a special “Do Not Use” system-only type of member.  Here, it is called Do_Not_Use_Elim.  We generally do not want users querying this member.  It’s just a temporary holding spot for storing the inverse balance for any intercompany accounts.  This member can be populated with a procedural calculation.

Image_14

It is important to note that the “Do Not Use” member should be populated in the same member combinations as the original budgeted amount, with the exception of the Data Source dimension.  Remember – this “Do Not Use” member is simply a holding spot.  Users should not query this member.

Abracadabra

The “real” magic happens in the member above called Elim.  In this member, a formula is added that filters when eliminations (stored in the “Do Not Use” member) are displayed and subsequently added to the base data.

Image_15

When the Elim member above rolls up to the Consolidated_Amount member, we see that the intercompany sales amount goes to zero.  In other words, it is eliminated.  (See row 15 below)

Image_16

The example above shows our original sale (row 3) and the inverse amount stored in the “Do Not Use” member (row 4).  Rows 7-10 show our original Entity and its ancestors.  We can see that the eliminations are only displayed at the first common ancestor and above (row 9 – 10).  Finally, in rows 13 – 16, we see the view that most users will retrieve, using the member Consolidated_Amount.  This member takes the base data in the Amount member and layers in the data in the Elim member.  As such, we can see that the sale exists in rows 13 & 14, but is eliminated in rows 15 and above.

Wrap-Up

Like most calculations in PBCS (and Essbase in general), there are multiple options for solutions, each with its own pro’s and con’s.  This solution works well against very large databases and has the added benefit of not requiring E-Companies.  Happy Eliminating!

Appearing in Oracle Magazine @ericerikson

Connecting the Value of IT: A Disciplined Solution for Service Costing and Chargeback @ranzal @orclEPMblogs @orclEPMblogs @orclEPMblogs @orclEPMblogs @orclEPMblogs @orclEPMblogs @orclEPMblogs @orclEPMblogs @orclEPMblogs @orclEPMblogs @orclEPMblogs @orclEPMblogs @orclEPMblogs @orclEPMblogs @orclEPMblogs @orclEPMblogs

$
0
0

This post corresponds to the webinar “Connecting the Value of IT: A Disciplined Solution for Service Costing and Chargeback,” the last in our “Let Your Profitability Soar” webinar series. You can access the recording here.


Within an organization, technology is mission-critical to most business strategies, and IT costs represent a significant portion of back office spend.

Among their many responsibilities, the CFO and the CIO must make sure that:

  • Technology spending is aligned with business strategy
  • Business applications and end-user services are delivered efficiently and cost-effectively
  • Coherent project portfolios that grow and transform the business are created and nurtured

Within this new economy, a key ongoing goal of the CIO is to make sure that IT is aligned with business strategy.

Generally, this IT-to-Business Strategy alignment is achieved in two ways:

  1. Running the business: Providing a cost-effective level of internal services necessary for sustaining business activity.
  2. Building the business: Managing and delivering portfolio development projects that are prioritized and aligned with all key business initiatives aiming to improve efficiency and aid in gaining competitive advantages.


The Nature of the Problem

One challenging pattern we see time and again is the ongoing disconnect between the CIO and the CFO.

Some might say this disconnect is an inevitable result of the fact that technology is moving so fast and we don’t always have the time to stop and assess its value. Understandably, it can be difficult for a CFO to get away from all the checks and balances just to get the financial books closed, let alone turn attention to the books that measure performance at greater depths, like line of business.

In general, as a function of the role, the CFO does not talk servers, desktop deployments, applications or other semantics of the technology business. Conversely, with many companies establishing Technology Shared Service Centers, pressure is placed on the CIO to operate the business of IT with the same financial disciplines the CFO requires of all lines of business. The CIO must connect the value of IT services and capabilities to internal business partners. To achieve this, IT Finance teams require performance management solutions that are IT-specific, yet are connected to Finance, to ensure efficient allocation of resources and effective delivery of internal services.

Part of the CFO’s role is to look at the technology projects and initiatives and think about how all of this technology is adding value. CIOs have to fill information voids, while also having to build their own financial models and performance management book of record using their own resources.

Two seemingly differing views of value can be hard to navigate and leverage. If two divergent approaches are not connected in a common view among the key stakeholders, then—more often than not—there is ongoing value-related confusion. Ultimately, the dissonance between the line of business owners can stall or even paralyze decision-making.

A Better Language Is Needed

For the good of your organization, it’s imperative that the CIO and the CFO speak the same shared language of value and that they connect in an effort to move forward in the most aligned and productive manner possible.

Speaking a shared language—one that offers a unified financial model view and is based on shared definition of value—is a key to finding a solution. The disciplines of ITFM (IT Financial Management) is about equipping both of these executive-level offices and their teams with a better language.

With an ITFM solution, you are able to:

  • Reduce the time that IT Finance spends on managing the business processes, providing more time for value-added analytical activities
  • Give IT Managers more detailed, timely, accurate data to better understand the cost & effectiveness of the services and projects they are delivering
  • Provide Line-of-Business managers with cost transparency into IT allocations and chargebacks, allowing them to better align their consumption of services with their business goals

ITFM focuses on these finance business processes:

  • IT Planning: Budgeting & forecasting of IT Operating and Capital Spend
  • IT Costing: Linking supply side financial cost structures with demand side consumption for services and projects
  • IT Chargebacks: Equitably charging lines of business for internal services and projects performed (or Showback)

IT Finance Organizations typically manage these processes through a series of multiple systems and offline spreadsheets. These processes are not ideal, as they create pain as far as inefficiencies and ineffectiveness in terms of results.

Our preferred solution for IT Service Costing—co-developed with Oracle—is based on PCMCS (Profitability and Cost Management Cloud Service). Oracle’s PCMCS is a cloud-based, packaged performance management application. It offers, in one package, a rules engine for cost allocations, embedded analytics and data management platform.

When developing the solution with PCMCS, the following were top priorities for our team:

  • That it required no large initial investment
  • That it was accessible to all
  • That it was always updated/up-to-date
  • That limited IT involvement was needed

Oracle IT Financial Management Solution Overview

Connecting Value of IT Image 1

The ITFM solution, a joint development effort with Oracle and based on valuable feedback and results from multiple Ranzal customer implementations, offers all of the following in one package:

  • Pre-Packaged Content for Cloud or On-Premise
  • Pre-Built Data Model
  • Pre-Built Costing Model & Reporting Content
  • Pre-Built Interface Specifications

A key component of the PCMCS IT Costing & Chargeback Template is its approach to modeling IT Like a Service Business, which includes the following modules:

  • Model Financials & Projects: This first step is focused on modeling financial projects, allowing you to combine multiple data sources, perform cost center allocations and, for those customers without an existing project costing system in place, to perform basic project costing and project allocation functions.
  • Complete Costing of IT Operations: This second pillar of the solution provides a flexible framework that allows you to combine data from multiple sources, perform resource costing and perform service costing.
  • IT as a Business Service Provider: This third leg of the solution service considers catalogue & bill rates, contribution cost trace, consumer showbacks and consumer chargebacks.

 We Have Options, You Have Options

Our Flexible Maturity Model allows customers to start where they feel most comfortable, and progress in a way that is focused on maximum flexibility for maximum effectiveness. No one size fits all, and we believe in starting right where you are.

Connecting Value of IT Image 2


For more information or to request a demo, email us. Be sure to ask if your company qualifies for our one-day complimentary PCMCS assessment of your IT Service Costing needs.


Understanding the Outline Extractor Relational Extraction Tables @jwj @orclEPMblogs @orclEPMblogs @orclEPMblogs @orclEPMblogs @orclEPMblogs @orclEPMblogs @orclEPMblogs @orclEPMblogs @orclEPMblogs @orclEPMblogs @orclEPMblogs @orclEPMblogs @orclEPMblogs @orclEPMblogs @orclEPMblogs

$
0
0
I was going to do a nice in-depth post to follow up on my discussion of the relational cache outline extraction method/improvements on the Next Generation Outline Extractor, but someone already beat me to the punch. It turns out that the tool’s primary author, Tim Tow, blogged about the technique and the tables for ODTUG […]

How to Use the Row Expander Visualization Plugin with Oracle Data Visualization Desktop (DVD) @PerfArchitects @orclEPMblogs @orclEPMblogs @orclEPMblogs @orclEPMblogs @orclEPMblogs @orclEPMblogs @orclEPMblogs @orclEPMblogs

$
0
0

Author: Margaret Motsi, Performance Architects

One of the ways to enhance data visualization is by enabling a fully interactive drill up and down experience in the data hierarchy. Oracle’s Data Visualization Desktop (DVD) uses the
“Row Expander” custom visualization plugin, available at the Oracle Public Store, to offer the capability to dynamically drill up and down attributes that may not necessarily belong to a hierarchical column.  This means that a user can switch back and forth between summary and detail data to form intermediate subtotals and quickly analyze data.  This blog post provides instructions on how to get started with this plugin.

From the Oracle BI Public Store, find the “Row Expander Viz” plugin box and click to download.

This action will create the following notification:

Click the “Download” link and copy content into the “plugins” folder; if your installation doesn’t offer  “plugins” folder, simply create one. Additional plugins should also go into this folder.

Restart DVD. Once restarted, you can view the plugin in the visualization options.

Select desired columns and then right-click on “Pick Visualization.”

Select the “Row Expander” plugin

The attributes display as rows in the canvas along with the selected metrics. The default view shows the summary data.

You can click on each attribute to drill up/down to the next level.

You can also add or remove attributes as you go. The number of attributes is equal to the number of levels you can drill up and down.

You can also create a filter on an attribute by right-clicking the attribute and selecting “Create Filter.”

The plugin will filter accordingly.

You can drill up and down on the filtered data.

When it comes to measures, this first version of the plugin has a couple of limitations.  First, the plugin is only capable of performing the “Sum Aggregation” function on metric values. It will be able to perform other calculations in future releases of DVD.  Second, the input dataset is limited to 500 rows for the plugin to perform accurately.

Need help or advice on data visualization plugins?  Contact Performance Architects at sales@performancearchitects.com and we’d be happy to help.


New Substitution Variable Methods/CLI in PBJ @jwj @orclEPMblogs @orclEPMblogs @orclEPMblogs

$
0
0
Just a few additions to the PBJ (PBCS REST API Java Library) regarding substitution variables. All of the new functionality is added to the PbcsApplication interface, for now. Since variables can exist in a specific plan type, it may make sense in the future to add a new interface/implementation that models a specific plan type. […]

Did you know... Provisioning can impact HFM and Reporting performance times @CheckPointllc @orclEPMblogs @orclEPMblogs @orclEPMblogs @orclEPMblogs @orclEPMblogs @orclEPMblogs

$
0
0

When comparing two roughly-equivalent environments, UAT and Staging, we kept running into a performance discrepancy we were unable to account for. We had the same data, rules, etc. in each HFM application, the same tuning parameters applied, and similar server host capabilities. We could not run a complex Task Scheduler instruction set in the same amount of time in each environment. UAT would take 90 minutes longer to complete the few dozen steps in the Task than Staging would.Examination of the log entries showed that for nearly every task in the list, it was taking approximately 150 seconds longer to perform each step in UAT than in Staging! We recreated the task list from scratch in Staging and found this extra time between steps was reduced to almost nothing. The same list was recreate in UAT and still ran 150 seconds longer between steps. The 11.1.2.4 Task Flow was being run by the same users in each environment, but was set to RUN AS a different user. When we ran as a simple ‘admin’-type user instead, as was used in the Staging environment, the extra time between steps vanished.

Review of the differences between the simple ‘admin’ user account and the LDAP user account being leveraged for the job in UAT showed the LDAP account had 7 PAGES, or about 3500 Native Group rules, being applied for provisioning. We advised the client of the cause of the issue, and saved them 90+ minutes by their provisioning a user with more straight-forward security.


Head in the Essbase Cloud No. 3 -- Costing the Essbase Cloud @CameronLackpour @orclEPMblogs

$
0
0

What price Essbase?

I can(‘t) get it for you wholesale

Oft times when I set pen to paper, I endeavor to get the geeky part of whatever I write just as accurately as I can manage to do.  Yes, I get bits wrong – Hah!  You’ll never, probably, know ‘cos I have a legion of haters fans who read my missives to you, Gentle Reader, with the zeal of Carrie Nation coming across Harry’s New York Bar whilst travelling Europe on $5 a day (‘natch, back home the 18th Amendment has shut down the honest whistle-wetting establishments so she’s got to go overseas) and, upon finding a teensy-weensy error on my part (Essbase is a very large egg that has gone off?  Planning is a color that reminds me of love?  I am a genius as yet undiscovered?  Non sequiturs are my chosen métier? ) point it out to me most lickety-split so that I may thus correct it before you even know it. – but they’re generally fixed just as soon as I can mutter culpa mea culpa and try to atone for the error of my ways.

Whew.  Did I lose you?  I know I lost myself but, through advanced navigation skills, have found myself again.

Unhappily, this post finds me (sorry, could not resist) in the unenviable position of an almost certainty of being corrected because:  none of this is technical, some of the information came to me secondhand, I’m making wild SWAGs about the mix of products, and, as Barbie once infamously said, “Math class is hard”. 

Money makes the world go round

On my laptop resides a Windows VM.  On that VM runs Windows 2008 Server (legally purchased I might note).  On that Windows install runs (most of) EPM 11.1.2.4.  You almost certainly have access to something like this.  You’ve paid for it (you’d better, Oracle customers, or an audit from Hell aka Oracle Contracts is almost certainly on its way), or you’re using it to evangelize the glories of Oracle software for free (Hah!, a second time because we all know I am far too lazy and stupid to ever profit from this blog.) and thus can use it for educational purposes which I fervently hope is tickety-boo with Oracle.  No matter how you’re here, you have a server(s), and someone installed Essbase and EPM and everything that goes with that.

If you’re using it in a commercial on-premises context, you’re paying for it.  There’s an upfront license fee and then a yearly maintenance charge equivalent to 22% of Essbase’s (or EPM-whatever’s) list price.  The server you run it on, the OS that surrounds Essbase, the relational database that supports EPM repositories, the backup software your firm buys, the antivirus package, the data center, etc., etc., etc., belong to your employer.  You (or your company) get to choose Linux over Windows, the Oracle Database over SQL Server, and so on down the line as you configure what makes Essbase your Essbase.  The choices and the costs are yours.

Essbase aka Oracle Analytics Cloud is totally different.

In the OAC cloud there are no:  local installs, VMs that you can see, payments to infrastructure consultants, patches, supporting software, or data centers and their server farms.  Other than the choice of buying Essbase in the cloud, there simply aren’t any choices to make; that’s all in Oracle’s bailiwick because Essbase Cloud is a PaaS product.  There are however monthly payments.  Some of these we can tease out but others Remain A Mystery that only an Oracle sales representative can answer.

Can’t means won’t and won’t means jail

No prison pallor is on the menu, but I can’t really know what you pay for on-premises Essbase nor can I tell you what Oracle will actually sell Essbase Cloud for.  The former is unknown because I haven’t (and don’t want to – there’s a reason I never got that JD) read your firm’s contract.  The latter is because, as my very first real world boss said, “Everything’s negotiable.”  I can say that generally there’s a 30% to 35% discount from list price on many of Oracle’s products but what you’ll actually pay is known only to you, your Oracle sales representative, and God.  Good luck.

What can I do through this post?  Break down all of the bits and bobs that actually comprise an Essbase Cloud instance because it’s not as clear as you might think.  With that information, you can berate/beseech/bargain with your Oracle sales representative when it comes down to cash on the proverbial barrelhead.  At least you’ll be forearmed when the reality distortion field known as a Sales Call envelops you.

What does it take to get to the cost of an Essbase Cloud instance?

I am, alas, not a wise old owl although with my glasses I do look a bit owlish so there’s that.

So just what are the components of an Essbase Cloud instance?  I’m not at all sure how one would figure that out based on OAC’s pricing page which really doesn’t list what it takes to truly run OAC.  

I’m not a lawyer but I play one on TV

OMG, the documents you’ll read to figure out what really and truly makes up and how much an Essbase Cloud instance costs.

To start with, take a look at

What you see below is my best guess as to what a customer actually needs to buy to get OAC at his company.  I could be – maybe am – wrong on this but as noted, this is what I can suss out.  I’ll correct this as I get corrections.  

There’s nothing secret here; your sales representative tell you all of this anyway (and as noted may correct some bits).  Regardless of the final validity of this information, my naiveté re just what makes up a cloud product appears to be without end:  I had no idea it took this many components.   

Non-metered

For non-metered usage, Essbase Cloud is comprised of:
Part
Description
Service type
Purpose
B87390
– or –
B87389
Oracle Analytics Cloud– Standard – Non-Metered – OCPU
-- or –
Oracle Analytics Cloud - Enterprise- Non-Metered – OCPU
PaaS
Essbase
B83531
Oracle Database Cloud Service - Standard Edition - General Purpose - Non-metered- Hosted Environment
PaaS
Database, Oracle, metadata, for the use of
B83543
Oracle Database Backup Cloud Service – Non-metered - TB of Storage Capacity
PaaS
Backup of Oracle database
B85643
Oracle Compute Cloud Service - Compute Capacity - 1 OCPU - Non-Metered
IaaS
CPU support for the Oracle database
B83456
Oracle Storage Cloud Service – Non-metered - TB of Storage Capacity
IaaS
Data storage
B83455
Oracle Compute Cloud Service - Block Storage - Non-metered -TB of Storage
Capacity
IaaS
Data storage

There are two paths to non-metered Essbase aka Oracle Analytic Cloud.  I believe but am not sure that the Enterprise product has full fat BICS as well as everything else in OAC.  See, I lied (again) when I wrote that this post would be uncorrectable.
  • B87390 Oracle Analytics Cloud– Standard – Non-Metered – OCPU which includes:  Essbase, BICS Mobile, 50 named users of Data Visualizer desktop per OCPU, Smart View for all users, and however many OCPUs you buy.
  • B87389 Oracle Analytics Cloud - Enterprise- Non-Metered – OCPU which includes:  BICS Mobile, 50 named users of Data Visualizer desktop per OCPU, Smart View for all users, one BICS administrator (I believe the significance of this is that Enterprise OAC is full BICS), and however many OCPUs you buy..  

Metered

NB – It’s not clear to me if metered and non-metered services can be combined, e.g. could a customer buy non-metered OAC but metered Storage?  OMG, have I mentioned who has the answer to this?  I have, haven’t I?

NB yet again – Although the OAC pricing page notes both metered and non-metered OAC, I can’t find OAC’s metered product numbers in Oracle’s Public Cloud Service Descriptions as of the writing of this post.  It’ll likely be there soon.

My bestest and most awesomest and quite likely wrongestguess as to what makes up metered OAC:
Part
Description
Service type
Purpose
B?????
– or –
B8????
Oracle Analytics Cloud– Standard – Metered – OCPU
-- or –
Oracle Analytics Cloud - Enterprise- Metered – OCPU
PaaS
Essbase
B78521
– or –  
B78522
Oracle Database Cloud Service-Standard Edition One Virtual Image-General Purpose OCPU per month – or – OCPU per hour
PaaS
Database, Oracle, metadata, for the use of
B77079, B77476,
B77477,
B77478
Oracle Database Backup Cloud Service – Metered
PaaS
Backup of Oracle database
B78516,
B78517,
B78518,
B78519,
B78520,
B85644,
B87082,
B87608,
B87285,
B87286
Oracle Compute Cloud Service –Compute Capacity - Instance – Metered
IaaS
CPU support for the Oracle database
B83456
Oracle Storage Cloud Service – Non-metered - TB of Storage Capacity
IaaS
Data storage
B83455
Oracle Compute Cloud Service - Block Storage - Non-metered -TB of Storage Capacity
IaaS
Data storage

Pricing

These are list prices.  Prices you can find, publicly, across all of those Read The Whole Thing™ links above.  What will you really pay?  As noted, it’s all negotiable and the only person that can really say is that Oracle sales rep I keep on referring to.  I am so far removed from the sales process I might as well be on another planet.  Come to think of it, I likely am on another planet (Vulcan?  Usra Minor Beta?) which explains all kinds of goofiness in my life both professional and personal.

A caveat re metered pricing:  I can’t even begin to understand it.  Read the docs, talk to your internal IT pricing analysts, talk to Oracle, but importantly, don’t bother asking me.  Non-metered is far easier although not necessarily a better fit for you.  Have I mentioned that you ought to talk to Oracle?  I have.  Again.

This example is for a two OCPU server (roughly four CPUs) with two terabytes of storage so a midsized Essbase server.

OCPUs explained

Just what is an OCPU?  Per Oracle’s, “Oracle Platform as a Service and Infrastructure as a Service – Public Cloud  Service Descriptions-Metered & Non-Metered” document:
Oracle Compute Unit (OCPU) is defined as the CPU capacity equivalent of one physical core of an Intel Xeon processor with hyper threading enabled. Each OCPU corresponds to two hardware execution threads, known as vCPUs.

What kind of Xeon chip at what speed isn’t spelt out in the Service Descriptions document.  Shall I repeat the “you should talk to” statement?  Good, there’s no need.

Part
Description
Quantity
Purpose
B87390
– or –
B87389
Oracle Analytics Cloud– Standard – Non-Metered – OCPU
-- or –
Oracle Analytics Cloud - Enterprise- Non-Metered – OCPU
PaaS
Essbase
B83531
Oracle Database Cloud Service - Standard Edition - General Purpose - Non-metered- Hosted Environment
PaaS
Database, Oracle, metadata, for the use of
B83543
Oracle Database Backup Cloud Service – Non-metered - TB of Storage Capacity
PaaS
Backup of Oracle database
B85643
Oracle Compute Cloud Service - Compute Capacity - 1 OCPU - Non-Metered
IaaS
CPU support for the Oracle database
B83456
Oracle Storage Cloud Service – Non-metered - TB of Storage Capacity
IaaS
Data storage
B83455
Oracle Compute Cloud Service - Block Storage - Non-metered -TB of Storage
Capacity
IaaS
Data storage

List pricing

The below numbers are straight from Oracle’s web pages.  Again, what you will pay for may very well be less.

Is it worth it?

Only you can answer that.  What you see in the list prices above is the full cost of the product.  This is all you pay for non-metered Oracle Analytics Cloud.  No servers, no installs, no fighting working with IT.  You have the whole kit and kaboodle.

So what are license costs for on-premises?  Were you to buy Oracle Essbase Plus from shop.oracle.com for four unlimited CPUs for one year the price is…

Wowzers.

That almost $200,000 (this number is a bit high because the first year’s support is a one-time charge that differs from the 22% yearly maintenance fee but still) doesn’t include any of the infrastructure or internal support:  servers, relational databases, installs, OS license fees, etc. without mentioning Data Visualizer.  OAC beats Essbase Plus when comparing list to discounted cost and it includes all of the things that PaaS brings to the table.

Oracle Analytics Cloud isn’t just a good deal, it’s a fantastic deal.  Perhaps you should talk to your Oracle sales rep?  Probably.

Be seeing you.

Don’t be afraid to correct me

I don’t think there’s anyone afraid of that.  Fire away and I’ll correct accordingly, especially around metered products.

NEW ODTUG Kscope17 Content @odtug @orclEPMblogs @orclEPMblogs @orclEPMblogs

$
0
0
Stay up to date on all things Kscope17: Introducing the Lunch and Learn, New Oracle Professional Tracks, In the Cloud sessions, On-Prem sessions, and the Kscope17 Schedule at a Glance.

FDMEE/Data Management – All data types in Planning File Format – Part 1 @orclEPMblogs @orclEPMblogs @orclEPMblogs @orclEPMblogs @orclEPMblogs @orclEPMblogs @orclEPMblogs

$
0
0
Recently a new load method was added to Data Management in EPM Cloud, there was no mention of it in the announcements and new features monthly updates document so I thought I would put together a post to look at the functionality.


The new load method is called “All data types in Planning File Format” which may be new for Data Management but the core functionality has been available in the Outline Load Utility since 11.1.2.0 of on-premise planning.

The cloud documentation provides the following information:

“You can include line item detail using a LINEITEM flag in the data load file to perform incremental data loads for a child of the data load dimension based on unique driver dimension identifiers to a Oracle Hyperion Planning application. This load method specifies that data should be overwritten if a row with the specified unique identifiers already exists on the form. If the row does not exist, data is entered as long as enough child members exist under the data load dimension parent member.”

I must admit that in the past when I first read the same information in the planning documentation it wasn't clear to me how the functionality worked.

It looks like the above statement in the cloud documentation has been copied from on-premise and is a little misleading as in Data Management you don’t have to include the flag in the source file because it can be handled by data load mappings.

Before jumping into the cloud I thought it was worth covering an example with the on-premise Outline Load Utility because behind the scenes Data Management will be using the OLU.

As usual I am going to try and keep it as simple as possible and in my example I am going to load the following set of employee benefits data.


Using the LINEITEM flag method with the OLU it is possible to load the data to child members of a defined parent without having to include each member in the file, so say you need to load data to placeholders this method should make it much simpler.

You can also define unique identifiers for the data so in the above example I am going to set the identifiers as Grade and Benefit Type, this means if there is data in the source file which matches data in the planning application against both the identifiers the data will be overwritten, if not the data will be loaded against the next available child member where no data exists for the given point of view.

It should hopefully become clearer after going through the example.

I have the following placeholder members in the Account dimension where the data will be loaded to, the Account dimension will be set as the data load dimension and the member “Total Benefits” will be set as the parent in the LINEITEM flag.


The data in the source file will be loaded against the following matching members in the Property dimension, these will be defined as the driver members.


The members are a combination of Smart List, Date and numeric data types.

I created a form to display the data after it has been loaded.


Before creating the source file, there are data load settings that need to be defined within Data Load Administration in the planning application.


The Data Load Dimension is set as Account and the parent member where the data will be loaded to is set as “Total Benefits”

The Driver Dimension is set as Property and the members that match the source data are defined as Benefit Type, Grade, Start Date, Active and Value.

The Unique Identifiers in the property dimension are defined as Benefit Type and Grade.

Now on to creating the source file, if you have ever used the OLU to load data you will know that the source file will need to include the data load dimension member which in this case will the line item flag, driver members, cube name and the point of view containing the remaining members to load the data to.

The format for the line item flag is:

<LINEITEM(“Data Load Dimension Parent Member”)>

So based on the data set that was shown earlier the source file would look something like:


You may ask why does the line item flag need to be on every record when it could just be included in the parameters when calling the OLU, this would make sense if loading data to children of only one member but it is possible to load to multiple members so it needs to be included in the source file.

The final step is to load the data file using the OLU and the parameters are the same as loading any type of data file.


The parameter definitions are available in the documentation but in summary:

/A: = Application name
/U: = Planning application administrator username
/D: = Data load dimension
/M: = Generate data load fields from header record in file.
/I: = Source file
/L: = Log file
/X: = Error file

You could also include the -f: parameter to set the location of an encrypted password file to remove the requirement of entering the password manually at runtime.

After running the script the output log should confirm the status of the data load.

Planning Outline data store load process finished. 4 data records were read, 4 data records were processed, 4 were accepted for loading (verify actual load with Essbase log files), 0 were rejected.

In my example four records were successfully loaded which is what I was hoping for.

Opening the form I created earlier confirms the data has been loaded correctly.


As no data previously existed for the POV the data was loaded to the first four children of “Total Benefits” and the unique identifier members would not apply in this case.

Let us load a record of data for the same POV and to matching unique identifiers, the unique identifier has been defined as a combination of members Grade and Benefit Type 


As matching data values already exist for “Grade 1” and “Health Insurance” under “Total Benefits”, this means the data should be updated instead of data being loaded to the next available child member.


The data has been updated where the identifier data values match and in this case the Active member data has changed from Yes to No.

Now let us load a new record of data where data values don’t match for the identifier members.


In the above example there is currently no matching data values of “Grade 3” and “Health Insurance” so the data should be loaded to the next available child member of “Total Benefits” where no data exists for that POV.


The data has been loaded against next available member which is “Benefit 5” as no data previously existed for the given POV.

So what happens when you try to load data and there are no available members left.


All five child members of “Total Benefits” have data against the above POV and as there is no matching data for the unique identifier combination the load fails with the following messages.

There is no uniquely identifying child member available for this member defined in Data Load Dimension Parent. Add more child members if needed.: 
,Plan1,"Jan,No Year,Forecast,Working,110,P_000",Grade 3,Car Allowance,01-05-2017,Yes,18000

Outline data store load process finished. 1 data record was read, 1 data record was processed, 0 were accepted for loading (verify actual load with Essbase log files), 1 was rejected.


At least the log provides exactly what the issue is and how to resolve.

I am going to leave it there for this post and in the next part I will look at how the same functionality has been built into FDMEE/Data Management and go through similar examples.

Webinar Tomorrow: One Stop Data Shop with Dodeca @jwj @orclEPMblogs @orclEPMblogs @orclEPMblogs @orclEPMblogs @orclEPMblogs @orclEPMblogs

$
0
0
I just wanted to plug a webinar that I am conducting tomorrow on Dodeca. I’m excited to do this webinar for a few reasons. Usually on our monthly webinar series we look at a specific feature and do a technical walkthrough. The focus of this webinar is a little different, though. This is more of […]

ODTUG Kscope17 Women in Technology Event & 2017 Women in Technology Scholar

$
0
0
Attend one of the hottest gatherings of the year – the ODTUG Kscope17 Women in Technology Event. Join men and women on Wednesday, June 28, at 12:15 PM for lunch, networking, and conversations surrounding workplace gender equality, workplace perception, work/life balance, and more.

ACE Alumni @timtow @orclEPMblogs @orclEPMblogs

$
0
0
Today, I asked Oracle to move me from Oracle ACE Director status to Oracle ACE Alumni status.  There are a number of reasons why I decided to change status.  When I started answering questions on internet forums years ago, I did it to share what I had learned in order to help others.  The same goes for this blog which I originally started so that I could give better and more complete answers to questions on the forums.

After the Hyperion acquisition by Oracle, I was contacted by Oracle who asked if I would be interested in becoming an "Oracle ACE".  It was an honor.  But over time, things have changed.  As more people found out about the ACE program, more people wanted to become an ACE.  If you have ever monitored the OTN Essbase and Smart View forums, they have become cluttered with copy and paste posts from people obviously trying to increase their points.  As the ACE program grew, it also become harder for the OTN team to manage and now require a formal activity reporting - a time report if you will - to track contributions to the community.  As I am already extremely pressed for time, I decided that tracking my contributions to the community - in exchange for a free pass to Open World, just didn't make sense.

All of that being said, just because I have moved to Oracle ACE Alumni status doesn't mean that I will stop contributing to the community.  My company will continue to provide free downloads and support for the Next Generation (Essbase) Outline Extractor and the Outline Viewer along with free downloads of Drillbridge Community Edition.  And maybe, just maybe, I will finally have time to write some new blog posts (maybe even some posts on some new Dodeca features inspired by our work with Oracle Analytics Cloud / Essbase Cloud!)

Three Big BI Market Drivers to Watch for The Rest of 2017 and Beyond

$
0
0


Author: Tony Tauro, Performance Architects

In 2017, we’ve seen an expansion of business intelligence’s (BI’s) scope, changes in consumption, and shifts in the roles of BI consumers and creators. Traditional and fundamental BI practices and processes, however, remain more important than ever.

As a result, the three major market drivers of BI trends so far in 2017 include:

  1. Get more from your data
  2. Do it faster and cheaper
  3. Make your data better

These are not mutually exclusive, but instead tend to reinforce each other and the general direction of BI trends.

1.     Get more from your data

Data is just bytes (or even bits) till someone can process it into information. Ideally, all the data sitting in our data warehouses has already been processed into information…of course, there is always better information if only we could read the data correctly. Data discovery and visualization are currently the hot tools to help us achieve more complete and better analysis of our data.

These tools are especially relevant because of the advent of another hot trend: big data. An easy way to understand big data is to think of the progression from to-do list to contact list to spreadsheet to relational database, and try to fill in what comes next: a solution that can handle data sets that are too big for traditional databases. And we are seeing more and more of such data sets now.

Once upon a time, manual data entry was the primary way to build data sets. Now data is introduced to data storage solutions automatically. Transactions are mostly electronic, and we have sensors producing data as well. It’s no wonder that our datasets are doubling in size every 2-3 years!  Big data tools are getting more and more prominent as companies realize the need to harness the power of this data.

Data discovery at its core is about interacting with your data the way you would with a search engine: ask a question and get an answer. Unlike a search engine, your data discovery solution gives you an appropriate (contextual) answer, considering items such as your role and permissions inside your company.

Visualization is about…visualizing your data, but it’s also about moving beyond the traditional graphs and charts that have always been used for BI. If data discovery is like using a search engine, visualization is a little like Wolfram Alpha, where you can query on a general topic, get in-depth information and find answers to questions you did not even know to ask.

Essentially data discovery and visualization techniques and solutions allow the consumer to create and discover the information needed, which brings us to the next topic.

2. Do it faster and cheaper

Since the days when humans fought velociraptors to win the evolutionary wars, “business people” have fought “IT people” for control of the reporting and analysis (BI) environment. Actually, one of those two things is pure hyperbole, but that is not the point.

“Self-service BI,” while not a new concept, is getting more traction now. While a diverse group, “business people,” are getting more savvy with BI solutions. At the same time, BI environments are getting more complex, making it even more important to get architecture and processes right.

Self-service BI is the concept that BI can be centrally managed, while also allowing “business people” to create their own set of reports, charts, graphs: basically, have their own BI and let IT manage it, too.

The savvy reader will note that data discovery and visualization are also forms of self-service BI, though that is not what is usually implied in general usage of the term “self-service.”

3. Make your data better

Data discovery pushes the boundaries for how we source data, going beyond the limits of the traditional data warehouses and bringing in data from more and newer sources (hence the search engine analogy earlier). this introduces questions about how to control data quality and how to improve data context.

Sometime after the Dark Ages, we came to the realization that the shiniest of dashboards get their credibility from boring old data quality and master data management processes. Transactions (e.g., sales orders, invoices, material movements, accounting documents) are great. They represent action and contain numbers that can be put into reports (like financial statements) and (gasp) glorious visualizations! However, without tying back to master data, the transactions are just business data (not information), and certainly do not provide context.

Ultimately data quality and management is about ensuring that the consumers of the data have a solid set of assumptions to use while translating that data into information. Keeping those assumptions true in the light of growing data sets and sources is a challenge (or opportunity… which one is it?), but is essential for the data discovery, visualization and self-service capabilities to stay relevant.


HFM 11.1.2.4 Task Flow and Consolidation Issues @CheckPointllc @orclEPMblogs @orclEPMblogs @orclEPMblogs @orclEPMblogs @orclEPMblogs @orclEPMblogs @orclEPMblogs @orclEPMblogs @orclEPMblogs

$
0
0

We discovered a few interesting things about consolidation tasks and HFM 11.1.2.4 at a recent client engagement. First, there is no “keep-alive” between HFM and the Oracle HTTP Server, so anything relying on a keep-alive will time out and cause issues later. Load balancers would need to have their keep-alive times adjusted, and OHS would need the entry for WLIOTimeoutSecs in the mod_wl_ohs.conf file adjusted upwards too.We saw this issue with our install due to Task  Flows that incorporated consolidation tasks. If a task in our environment took more than 5 minutes to complete, a new identical task would be spawned. The consolidation CPU requirements were exceeding the capabilities of the HFM servers because of this. We adjusted the LB timeout and got our test task to not duplicate. However, it only took 23 minutes to complete. We found the OHS timeout (7200 seconds, or 2 hours) in our environment when we ran longer consolidation tasks. We upped the timeout to 16 hours in OHS and have not seen a repeat of the issue.

In addition to the extra task being spawned, the task takes up a connection in the EPMSystemRegistry pool in WebLogic - default is 30, so if you have a LOT of consolidation tasks, you can exceed this value and cause failure for other tasks that require a connection to that pool.

The plan is for Oracle to introduce a keep-alive in HFM in version 11.1.2.4.300, scheduled for release in November 2017.

FDMEE/Data Management – All data types in Planning File Format – Part 2 @orclEPMblogs @orclEPMblogs @orclEPMblogs @orclEPMblogs @orclEPMblogs @orclEPMblogs @orclEPMblogs

$
0
0
Moving swiftly on to the second part where I am going to look at the “all data types in planning file format” load type in Data Management, the functionality is basically the same as what I covered in the last part with the on-premise Outline Load Utility but has now been built into Data Management, I am hoping that by providing the examples in the last post it will make more sense when setting up the integration in Data Management.

Currently the functionality only exists in EPM Cloud but I would expect this functionality to be pushed down to on-premise FDMEE possibly when 11.1.2.4.220 is released, I will update this post once it is available.

Once again I will start out with the same employee benefits source data but this time the file can be kept much simpler as Data Management will handle the rest.


Just like with on-premise the data load settings need to be applied and these can be accessed through the navigator under integration.


It is a shame that these settings cannot be dynamically generated or be defined in Data Management instead of having to set them in planning.

On to Data Management and creating the import format, the file type is set to “Multi Column – All Data Type”.


In the import format mappings, I have basically fixed the members to load to by entering them into the expression field, this replicates the example in the last part using the OLU and fixing the POV in the file.


For the account dimension I could have entered any value in the expression field as it will be mapped using the line item flag in the data load mappings.

The Data dimension will be defined by selecting add expression and choosing Driver, I explained this method in detail in a previous blog on loading non-numeric data.


Basically the driver dimension is selected which in my example is the Property dimension, the first row is the header row and contains the driver members and the data is across five columns.


The mapping expression window provides examples if you are unsure of the format and the expression field will be updated with the values entered.


The data rule is created in the same way as any other integration.


The difference comes when setting up the target options, the load method this time will be “All data types in Planning File Format”.

There are also properties to define the Data load and Driver dimensions, these will match what has been set in the Data Load Settings in planning.


Seems a bit excessive having to set the driver dimension in planning, in the import format and in the data load rule, it would be nice if all these settings could be applied in one place in Data Management.

There is only one difference with data load mappings and that is for the data load dimension the LINEITEM format must be used.


The target value will need to be manually entered with the data load dimension parent member but after going through my example with the OLU it should be clearer to why it is required.

On to the data load and the data columns in the file will be converted into rows in the workbench.


In my source file there are five columns and four rows of data so a total of twenty records are displayed in the workbench.

The final step is export and load the data in to the planning application.


All good but a quick check of the data form in planning and something is not right.


Only the equivalent of one row of data has been loaded and the data that has been loaded is not correct.

The process log confirms that the outline load utility is definitely being used to load the data just like with the earlier example I went through, though in this case only one row has been processed and loaded.

13:10:36 UTC 2017]Outline data store load process finished. 1 data record was read, 1 data record was processed, 1 was accepted for loading (verify actual load with Essbase log files), 0 were rejected.

13:10:36,825 INFO  [AIF]: Number of rows loaded: 1, Number of rows rejected: 0


I checked the file that Data Management had generated before loading with the OLU and even though the format is correct there was only one record of incorrect data in the file.


The file should have been generated like:


The file is generated by converting rows into columns by using the Oracle database pivot query and outputting driver members and values as XML.

13:10:29,528 DEBUG [AIF]: SELECT * FROM ( SELECT ACCOUNT,UD4,DATA,'"'||ENTITY||','||UD1||','||UD2||','||UD3||','||SCENARIO||','||YEAR||','||PERIOD||'"'"Point-of-View"
                      ,'Plan1'"Data Load Cube Name" FROM AIF_HS_BALANCES WHERE LOADID = 598 )
PIVOT XML( MAX(DATA) FOR (UD4) IN (SELECT UD4 FROM AIF_HS_BALANCES WHERE LOADID = 598) )

I replicated the data load in on-premise FDMEE, ran the same SQL query and only one row was returned.


The query returns the driver members and values as XML which then must be converted into columns when generating the output file.


At this point I thought it might be a bug but thanks to Francisco for helping keep my sanity, I was missing a vital link which was not documented, I am sure the documentation will get updated at some point to include the missing information.

If you have records that are against the same POV then you need a way of making the data unique so that when the SQL query is run all rows are returned, this is achieved by adding a lookup dimension and identifying a driver member that will make the data unique.

If you take the data set I am loading the driver member “Grade” values are unique so this can be defined as a lookup dimension.

To do this you first add a new lookup dimension to the target application.


The lookup dimension name must start with “LineItemKey” and depending on the data that is being loaded you may need multiple lookup dimensions to make the records unique.

Next in the import format mappings the dimension should be mapped to a column containing the driver member.


The “Grade” member is in the first column in my source file so I map the lookup dimension to that.

After adding a like for like data load mapping for the lookup dimension the full load process can be run again.


The workbench includes the lookup dimension and is mapped to the driver member Grade.
The SQL statement to generate the file now includes the lookup dimension which was defined as column UD5 in the target application dimension details.

17:16:36,836 DEBUG [AIF]: SELECT * FROM ( SELECT ACCOUNT,UD4,DATA,'"'||ENTITY||','||UD1||','||UD2||','||UD3||','||SCENARIO||','||YEAR||','||PERIOD||'"'"Point-of-View"
                      ,'Plan1'"Data Load Cube Name" ,UD5 FROM AIF_HS_BALANCES WHERE LOADID = 634 )
PIVOT XML( MAX(DATA) FOR (UD4) IN (SELECT UD4 FROM AIF_HS_BALANCES WHERE LOADID = 634) )

17:16:36,980 INFO  [AIF]: Data file creation complete


Once again I replicated in on-premise and the query correctly returns four records.


Even though the query results include the lookup dimension this will be excluded when the output file is created.


This time the process log shows that four records have been loaded using the OLU.

17:16:49 UTC 2017]Outline data store load process finished. 4 data records were read, 4 data records were processed, 4 were accepted for loading (verify actual load with Essbase log files), 0 were rejected.

17:16:49,266 INFO  [AIF]: Number of rows loaded: 4, Number of rows rejected: 0


The planning form also confirms the data has been successfully loaded and is correct.


Now that I have the integration working I can test out the rest of the functionality, I am going to load a new set of data but where data already exists for the unique identifier driver members


The unique identifier members are “Grade” and “Benefit Type”, data already exists under “Total Benefits” for “Grade1” and “Health Insurance” so the data being loaded should replace the existing data.


The data has been overwritten as the value for Active has been changed from “Yes” to “No”

Now let us load a new set of data where there is no matching data for the unique identifiers.


Before the load there was no data for “Grade 3” so the data should be loaded to the next available child member of “Total Benefits” where no data exists for the given POV.


The data has been loaded against next available member which is “Benefit 5” as no data previously existed for the given POV.

Next to test what happens when loading a data set with no matching driver member identifiers now that all child members of the data load dimension parent are already populated.


The export fails and the process log contains the same error as shown when testing the OLU as in the last post.

13:21:07 UTC 2017]com.hyperion.planning.HspRuntimeException: There is no uniquely identifying child member available for this member defined in Data Load Dimension Parent. Add more child members if needed.

13:21:07 UTC 2017]Outline data store load process finished. 1 data record was read, 1 data record was processed, 0 were accepted for loading (verify actual load with Essbase log files), 1 was rejected.


As the log suggests in order for the export to succeed additional members would need to be added under the data load dimension parent.

Since adding the lookup dimension all the data values have been unique for the “Grade” member so there have been no problems, if I try and load a new set of data where the values are no longer unique you can probably imagine what is going to happen.


The above data set contains “Grade 1” twice so now the lookup dimension is not unique and even though the load is successful we are back to where we were earlier with one record of incorrect data being loaded.


This means another lookup dimension is required to make the data unique again so I added a new lookup dimension, mapped it to the “Benefit Type” column in the import format, created a new data load mapping for the new dimension and ran the process again.


In the workbench, there are now two lookup dimensions present which should make the data unique when creating the export file.


Much better, the data loaded to planning is as expected.

In the whole the functionality in Data Management acts in the same way as when using the on-premise Outline Load Utility, I do feel the setup process could be made slicker and you really need to understand the data as if you don’t define the lookup dimensions to handle the uniqueness correctly you could end up with invalid data being loaded to planning.

Export Substitution Variables, The PBCS Edition I

$
0
0

The post Export Substitution Variables, The PBCS Edition I appeared first on The Unlocked Cube and created by Vijay Kurian.

These days, I find myself working with on-premises applications quite a bit. So, once in a while, it is refreshing to look at what some Planning’s cloud counterpart can do. One of my absolute favorite features that Oracle has rolled out over the last few years is the advent of the REST APIs. I thought……

Continue reading

The post Export Substitution Variables, The PBCS Edition I appeared first on The Unlocked Cube and created by Vijay Kurian.

EPBCS Data Maps – How to improve the Headcount Transfer to Reporting

$
0
0

Data Maps is a great feature in PBCS that allows you to seamlessly move data between plan types and to your reporting databases. You can map smart lists to dimensions in ASO reporting cubes to convert the accounts to dimensions so that you can easily report in Smart View and Reports. It works great when you have similar dimensionality but if you really have extensive mapping you should use Data Management to move the data between cubes. As we use EPBCS, and take advantage of the out of the box content we have hit a few performance issues with data maps. Here is a recent solution we devised to resolve slow transfers of data between the Workforce cube and the ASO Workforce reporting cube.

OVERALL PERFORMANCE

Essbase is not great at extracting members that are stored as dynamically calculated. You will see this if you execute a data map and all of the sudden a quick map is now taking a considerable time to run. Most likely there are dynamical calculated members recently added to your selection. Luckily you can disable dynamically calculated members in the map. To enable this option edit the Data Map and click the Options button. In the window that displays click the option to Exclude Dynamic Calc Members.

Then run the map again and it should be back to what you are use to. However you may be missing some data that you expect to be there. If you cannot discover what the dynamic calc members are, create a data export calc script with the same source point of view and the option DataExportDynamicCalc OFF. Run the script in calc manager and the log tab will inform you what members where excluded from your export. You can then investigate how you can include them in your data map as stored members.

OWP_Headcount Data for Reporting

As your plan and forecast grows you will see that this map will get slower and slower. It is created out of the box for the Workforce Planning module. Its purpose is to move the headcount data from the WFP cube to the ASO reporting cube that is supplied with the solution. The main reason this is slow is because the source of the headcount data is a dynamically calculated account.


The reporting cube and the WFP cube share the parent OWP_Total Headcount. In the WFP cube it is a dynamic calculated parent account and in the ASO cube it is a level 0 account. The data map is not optimally designed, and you cannot select the exclude dynamic calc option because no data will move over.

Here is the solution I found.

Step one edit the data map. Then click the red x to the right of the accounts dimension.

This will move the Account dimension to the Unmapped Dimension section. Click on the hyperlink OWP_Total Headcount and open the member selector.

Clear the current selection and the select every level 0 member under OWP_Total Headcount except OWP_Departed Headcount.

Then on the Target select the account OWP_Total Headcount.

Then click the Save and Close option. You will then get an error message that you cannot save the map because there is an invalid member OWP_Total Headcount.

This error is a defect because in the ASO cube the member is a level 0 and without a formula .

Since that member was created by WFP you cannot edit any part of it. To work around this error temporarily point the map to the account OWP_Compensation Expenses. This should let you save the map.

Now that it is saved navigate to Variables. Create a substitution variable at the All Cubes level called TARGET_HC_ACCOUNT and set the value to OWP_Total Headcount.

Click ok, and then edit the Headcount map again. Edit the account dimension on the target side of the map. Enable the Substitution Variables selector and select the substitution variable TARGET_HC_ACCOUNT.


Now when you click Save and Close the Data Map will save!!!


THIS MAP SHOULD NOW FLY!!!!!!

Take a look at some results from a client app below:

The out of the box method took almost 12 minutes mostly all extracting that dynamically calculated data. With the modifications it ran with the same results in 9 seconds!

CONCLUSION

Dynamically calculated members are great for reporting but they have no place in data exports, and obviously do not belong in Data Maps! I hope that this solution helps you with your implementation of EPBCS or even in your own custom apps.

Thanks for reading. Have a great Memorial Day Weekend and remember:
A hero is someone who has given his or her life to something bigger than oneself.“ Joseph Campbell


Essbase data loss and data shifting due to IMPLIED_SHARE setting @epminsight @orclEPMblogs @orclEPMblogs

$
0
0

Per the Oracle technical reference for IMPLIED_SHARE the following steps must be performed any time the IMPLIED_SHARE setting is changed in essbase.cfg:

  1. Add IMPLIED_SHARE FALSE to essbase.cfg.
  2. Restart Essbase Server.
  3. Create a new application and database, with the IMPLIED_SHARE setting in place.
  4. Rebuild the outline, with the IMPLIED_SHARE setting in place.
  5. Reload the data.
  6. Run aggregation or calculation scripts.
  7. Restart the application.

However, the technical reference does not say what would happen if the above steps are not performed. May be the implied share would not work as expected. However, on one of my recent projects we did not do the above steps and updated essbase.cfg with the implied share setting. We encountered a data loss one on of the Essbase cubes, specifically, data part of a partition area was cleared and some of the data was literally shifted to weird combinations. This event occurred when the Essbase service was restarted. Note that the data loss did not occur every time the Essbase service was restarted.

It took a bit of time to figure out what was going on. I found a document on Oracle support for an issue having the same symptoms i.e. after adding the setting IMPLIED_SHARE TRUE/FALSE value to the Essbase.cfg file and restarting the Essbase service, data is lost or shifted in Essbase.  Oracle support referred me to the same document id. The document id on Oracle Support is 1539305.1.  Per this document, the cause of the issue is an unpublished Bug 14258058 –  IMPLIED_SHARE setting change to Essbase.cfg requires database restructure.

This is a serious issue and would expect that Oracle would add more information to the documentation covering system behavior if the IMPLIED_SHARE settings are done without the required steps.

The Essbase version on which this issue was encountered was Essbase 11.1.2.4.012

The post Essbase data loss and data shifting due to IMPLIED_SHARE setting appeared first on epminsight.

Viewing all 1880 articles
Browse latest View live