Quantcast
Channel: ODTUG Aggregator
Viewing all 1880 articles
Browse latest View live

Consolidation Applications – The Path Forward

$
0
0

This year I have seen an increase in clients looking at the future of their consolidation applications. They’re finding that the path forward remains murky. Oracle did, however, provide an update regarding the path for HFM at Kscope18.

HFM Support

HFM version 11.2 is scheduled for release Q1 2019. Support for this version will run through 2030. Support for HFM 11.1.2.4 is scheduled to end December 2020. This allows companies a window of almost two years to upgrade HFM if they chose that path.

FCCS

Most companies are interested in going to the cloud overall and IT is in full support of this move. Finance, however, is more interested in the functionality than the delivery of it(on-premise or cloud). Oracle continues to enhance FCCS but it still has a ways to go. The biggest challenge is the lack of custom dimensions.

Custom dimensions are scheduled for FCCS. Scheduled is the operative word here. The majority of the applications I have worked with include three to four custom dimensions. Most of the time the standard FCCS dimensions cannot replace all of these. The lack of support for additional customs dimensions is a major roadblock for companies moving to FCCS.

At this point, most clients are continuing to take a wait and see approach. Some of these on unsupported versions of HFM and are moving forward with an upgrade to 11.1.2.4 with the awareness that they will then have to upgrade again in the next two years. Clients on more current releases of HFM are waiting until 11.2 is available. This approach buys time for FCCS to mature further. When HFM v11.2 is released, I expect that they will take another look at FCCS and OneStream before making the decision to move ahead with the 11.2 upgrade.

What if We Need to Rebuild?

You might need an application rebuild because you are implementing a new ERP or your reporting requirements have changed to the point that your present application does not support them. If you find yourself in a situation where you need to rebuild your consolidation application, I recommend you look at this differently. A rebuild for whatever reason is a major effort and you should do it using an application that will be around for probably 10+ years. Of course, the easy answer is to build the application in HFM. However, if you take a deeper look, this is not the best answer because the effort of a rebuild is so great and we know that HFM does have a limited life. The better approach is to consider doing this in FCCS or OneStream.

The Path Forward

Accountants are conservative by nature. They like and are comfortable with their HFM applications. When we discuss the future, we agree that it is easy and safe to upgrade HFM and take the wait and see approach. But I also tell them that it nearing the time when they need to look at what their consolidation application will be after 2020. And, the consolidation application evaluation needs to include HFM, FCCS, and OneStream.

The post Consolidation Applications – The Path Forward appeared first on TopDown Consulting Blog.


2019 Leadership Program - Now Accepting Applications

$
0
0
Are you looking to invest in your professional development? Do you enjoy the ODTUG community and are you looking to become more involved? The ODTUG leadership program is a great way to accomplish both goals and broaden your network.

EPRCS Updates (August 2018): Drill to Source Data in Management Reporting, Improved Variable Panel Display in Smart View & More

ARCS Updates (August 2018): Changes to Filtering on Unmatched Transactions in Transaction Matching, Considerations & More

$
0
0

The August updates for Oracle's Account Reconciliation Cloud Service (ARCS) are here. In this blog post, we’ll outline new features in ARCS, including changes to filtering on unmatched transaction matching, considerations, and more.

We’ll let you know any time there are updates to ARCS or any other Oracle EPM cloud products. Check the US-Analytics Oracle EPM & BI Blog every month.

The monthly update for Oracle ARCS will occur on Friday, August 17 during your normal daily maintenance window.

FCCS Updates (August 2018): Enhancements to Close Manager, Ability to Create Journals for Entities with Different Parents & More

PBCS and EPBCS Updates (August 2018): Incremental Export and Import Behavior Change, Updated Vision Sample Application & More

Two Minute Tutorial: How to Access the OAC RPD

$
0
0

In this two-minute tutorial, I’ll walk you through how to access the OAC RPD in two methods…

  • Accessing it through the Admin Tool
  • SSH into the server

Available to download - Oracle Data Visualization Custom PLUGIN "Elbow" Dendrogram

$
0
0
Excited to announce that a custom PLUGIN I have been working on is available to download and start using now - available on

The Oracle Analytics Library: https://www.oracle.com/solutions/business-analytics/data-visualization/extensions.html

Within the Extensions tab

or download here


Name:"Elbow" Dendrogram

Authors: G. Adashek & D.Flores

Description:
The “Elbow” Dendrogram creates a hierarchy based Parent-Child like structure with ‘links-arms’ that are bent at a 90° angle. This plugin can render a #measure element and is zoomable.


MDX Generate()

$
0
0
I'm writing this post because I forget stuff all the time. This is one of those things I learned a few months ago and nearly forgot already...

One of the trickiest parts of dealing with MDX is shared members. They look different than regular members so a lot of functions don't recognize the stored and shared members as being the same. If you want them to look the same you need to use the Generate() function.

Suppose you want to compare a list of children to the currently selected member. It won't usually work if those children are shared members.


The following formula will yield a false result when the currently selected member is Flat Panel or HDTV or any of those shared members you see above.

IsChild([High End Merchandise].children,Products.CurrentMember)

In order to "clean" the shared nomenclature from the member you need to use Generate(). This will return a true result.

Contains([Products].CurrentMember,
               {Generate([High End Merchandise].Children
                                 {StrToMbr(Products.CurrentMember.Member_Name)})})

In this case Generate() loops through the set of children, returning the the cleaned up product name  into a new set. That set is then evaluated against the current product selection.

Build a Homelab Dashboard: Part 7, pfSense

$
0
0

After a small break, I’m ready to continue the homelab dashboard series! This week we’ll be looking at pfSense statistics and how we add those to our homelab dashboard. Before we dive in, as always, we’ll look at the series so far:

  1. An Introduction
  2. Organizr
  3. Organizr Continued
  4. InfluxDB
  5. Telegraf Introduction
  6. Grafana Introduction
  7. pfSense

pfSense and Telegraf

If you are reading this blog post, I’m going to assume you have at least a basic knowledge of pfSense. In short, pfSense is a firewall/router used by many of us in our homelabs. It is based on FreeBSD (Unix) and has many available built-in packages. One of those packages just happens to be Telegraf. Sadly, it also happens to be a really old verison of Telegraf, but more on that later. Having this built in makes it very easy to configure and get up and running. Once we have Telegraf running, we’ll dive into how we visualize the statistics in Grafana, which isn’t quite as straight forward.

Installing Telegraf on pfSense

Installation of Telegraf is pretty easy. As I mentioned earlier, this is one of the many packages that we can easily install in pfSense. We’ll start by opening the pfSense management interface:

For most of us, we’re looking at our primary means to access the internet, and as such I would recommend verifying that you are on the latest version before proceeding. Once you have completed that task, you can move on to clicking on System and then Package Manager:

Here we can see all of our installed packages. Next we’ll click on Available Packages:

If we scroll way down the alphabetical list, we’ll find Telegraf and click the associated install button:

Finally, click the Confirm button and watch the installer go:

We should see a success message:

Now we are ready to configure Telegraf. Click on the Services tab and then click on Telegraf:

Ensure that Telegraf is enabled and add in your server name, database name, username, and password. Once you click save, it should start sending statistics over to InfluxDB:

pfSense and Grafana

Now that we have Telegraf sending over our statistics, we should be ready to make it pretty with Grafana! But, before we head into Grafana, let’s make sure we understand which interface is which. At the very least, pfSense should have a WAN and a LAN interface. To see which interface is which (if you don’t know offhand), you can click on Interfaces and then Assignments:

Once we get to our assignments screen, we can make note of our WAN interface (which is what I care about monitoring). In my case, its em0:

Now that we have our interface name, we can head over to Grafana and put together a new dashboard. I’ve started with a graph and selected my TelegrafStats datasource, my table of net, and filtered by my host of pfSense.Hyperion.local and my interface of em0. Then I selected Bytes_Recv for my field:

If you’re like me, you might think that you are done with your query. But, if you take a look at the graph, you will notice that you are in fact…not done. We have to use some more advanced features of our query language to figure out what this should really look like. We’ll start with the derivative function. So why do we need this? If we look at the graph, we’ll see that it just continues to grow and grow. So instead of seeing the number, we need to see the change in the number over time. This will give us our actual rate, which is what the derivative function does. It looks at the current value and provides the difference between that value and the value prior. Once we add that, we should start to see a more reasonable graph:

Our final query should look like this:

Next we can go to our axes settings and set it to bytes/sec:

Finally, I like to set up my table-based legend:

Now let’s layer in bytes_sent by duplicating our first query:

And our final bandwidth graph should look like this:

Confirming Our Math

I spent a lot of time making sure I got the math right and the query, but just to check, here’s a current graph from pfSense:

This maxes out at 500 megabits per second. Now let’s check the same time period in Grafana:

If we convert 500 megabits to megabytes by dividing by 8, we get 62.5. So…success! The math checks out! This also tells me that my cable provider upgraded my from 400 megabit package to 500 megabit.

Conclusion

You should be able to follow my previous guide for CPU statistics. One thing you may notice is that there are no memory statistics for your pfSense host. This is a bug that should be fixed at some point, but I’m on the latest version and it still hasn’t been fixed. I’ve yet to find a decent set of steps to fix it, but if I do, or it becomes fixed with a patch, I’ll update this post! Until next time…when we check out FreeNAS.

The post Build a Homelab Dashboard: Part 7, pfSense appeared first on EPM Marshall.

PBCS Data Backup and Recovery Scenarios [Tutorial] @usanalytics @orclEPMblogs @orclEPMblogs @orclEPMblogs @orclEPMblogs @orclEPMblogs

$
0
0

Recently, I created several types of backups and recovering methods using the applications snapshots, PBCS exports, and Essbase Data Export business rules to export and import data.

The application exports data in a formatted file in a way that another application can read it and use the data. This typically requires adjusting for naming conventions. We can do this in SQL and in FDMEE. If it’s straightforward — like for recovering data or for migrating data into a different environment — then the Essbase data export will work. The PBCS data export will also work if we’re looking for a non-technical approach. These methods enable the two systems to share the same data.

In searching for the best method, I’ve found a few different options. In this blog post, I’ll show you the business case for PBCS data backup and recovery, along with how to execute several of these techniques.

Retro Reboot #1: Set It & Forget It – Scheduling FDMEE Tasks @ranzal @orclEPMblogs @orclEPMblogs @orclEPMblogs @orclEPMblogs @orclEPMblogs @orclEPMblogs

$
0
0

As with most nostalgic items, reboots are the next best thing. From video game consoles to television shows, they are all getting a modern facelift and a new prime-time seat on television.  I have jumped on that band-wagon to revitalize a previous post authored by Tony Scalese: Set it & Forget It – Scheduling FDM Tasks.

As with most reboots, there must be flair and alluring content to capture old and new audiences. Since Oracle Financial Data Quality Management Enterprise Edition (FDMEE) has been in the Enterprise Performance Management (EPM) space for a while and has moved into the Cloud, this is a great time for its reboot!

Oh Great…A Reboot. Now What?

 Scheduling tasks in FDMEE has never been easier. Oracle provides several ways to do this for a variety of out-of-the-box activities.  Is there a report that you want to run and email every hour?  Or how about a script that needs to run hourly?  Or maybe batch-automation every 15 minutes?  No worries!  FDMEE can handle all of that with out-of-the-box functionality.

Let us pause for a moment and determine what is needed to make this happen:

  1. Is there a business case and justification for what is about to be scheduled?
  2. Who benefits and how will they be notified of the results?
  3. Is there a defined frequency for which the activity must take place?

Getting Started

First, understand that the scheduling for FDMEE is built directly into the Graphical User Interface (GUI) anywhere you see the “SCHEDULE” button. Unlike the previous FDM counterpart which had it as an independent utility to be installed/configured, the ease of having it via the Web has removed some complexity.

A word of caution:  while this screen allows items to be scheduled, there isn’t a screen that shows “what has been” scheduled.  To do that, access to the Oracle Data Integrator (ODI) is needed, but more on this later.

Initially, the screen shows the types of schedules that can be created and their relevant inputs.

Retro Reboot Screen Shot 1

Below is a reference guide to outline FDMEE’s scheduling capabilities.

Schedule TypeInputsNotes / Examples
SimpleTimeZone, Date, HH:MM:SS, AM/PMSingle run based on the specified inputs.


Example:  Run 08/02/2018 @ 11AM

HourlyTimeZone, MM:SSRepeatable run at the specified time MM:SS time.


Example:  Run every hour, at the 22minute mark.

DailyTimeZone, HH:MM:SS, AM/PMEvery day at the specified time.


Example:  Run every day at 11AM.

WeeklyTimeZone, Day of the Week, HH:MM:SS, AM/PMEvery specified day at the specified time.


Example: Run every Monday thru  Friday at  11AM.

Monthly
(day of month)
TimeZone, Date, HH:MM:SS, AM/PMSpecified day at the specified time.


Example: Run on the 2nd day of every month at 11AM.

Monthly
(week day)
TimeZone, Iteration, Weekday, HH:MM:SS, AM/PMSpecified interval and week day at the specified time.


Example: Run every third Tuesday at 11AM.

Why Does the Job Run Under My UserID?

That is because the system assigns the user’s credentials who created the schedule. What can go wrong with that, right?!  Well, if a user no longer exists or a password is changed, the existing jobs will no longer run.

The following considerations should be observed:

  1. Dedicate a service account that is not being used by an employee to be used for server/automation actions.
  2. This account can be a “native” user; since the account is only used internally for EPM products, having a domain account is not needed.
  3. Non-expiry passwords are best.

 It is Scheduled…Now What?

After the item is scheduled, what really happens? The action executes at the scheduled time!  Actions can easily be monitored via the FDMEE Process Details screen.  Now all the possibilities of scheduling the following can be explored:

  1. Data Load Rules
  2. Script Executions
  3. Batch Executions
  4. Report Executions

Also, as mentioned earlier, there is no way to see the batches inside of FDMEE. For that, information can be retrieved in a few ways.  The easiest way to see what is scheduled is to use the ODI Studio.

The ODI Studio provides details as seen in the screen shot below:

Retro Reboot Screen Shot 2

Any scheduled tasks will be listed under “All Schedules.” Simply double click them to obtain details related to that task.

Retro Reboot Screen Shot 3

Another effective option is to write a custom report that displays the information. My previous blog, Easy Value with FDMEE Reports, post provides further details of FDMEE report options and their value.  This would allow a report to be executed to provide a user-friendly report.

Seriously … What Now?

By now, you may have noticed from the previous blog post http://classic.fdmguru.com/ups-shell/) that the upsShell process is quite handy.  It allows other tools to control the FDM jobs…maybe through a corporate scheduler.  Now that most organizations have a corporate scheduler, the new FDMEE options below must be learned:

CommandPurpose
Executescript.bat / .shExecutes an FDMEE Custom Script
Importmapping.bat / .shExecutes an import from text-file for Maps
Loaddata.bat / .shExecutes a Data Load Rule
Loadhrdata.bat / .shExecutes an HR Data Load Rule
Loadmetadata.bat / .shExecutes a Metadata Load Rule
Runbatch.bat / .shExecutes a defined Batch
Runreport.bat / .shExecutes a defined Report

*All files are stored in the EPM_ORACLE_HOME\products\FinancialDataQuality\bin\

In the example below, the command, when launched, executes a Data Load Rule for Jan-2012 thru Mar-2012:

Retro Reboot Screen Shot 4

There still must be a better solution…right? Things to overcome:

  1. What happens if the scheduler is Windows-based and the server is Linux?
  2. How does a separate scheduling server communicate with EPM? Does it have to be installed on each EPM Server?
  3. How can we monitor and get details of a job once it is kicked off?

What Happens if You Don’t Want to Run the .BAT/.SH Files?

You’re in luck! With the introduction of new functionality to FDMEE, RESTful APIs are also now available.  With the RESTful APIs, not only can you execute a job, but you can also loop and monitor for the results.  This enhances the previous .BAT/.SH file routines and provides a cleaner and more elegant solution.

CommandPurpose
Running Data RulesExecute a Data Load Rule
Running Batch RulesExecute a Batch Definition
Import Data MappingImport Maps
Export Data MappingExport Maps
Execute ReportsExecute a Report

*URL construct: https://<SERVICE_NAME>/aif/rest/V1

The below example is just querying for a process:

Retro Reboot Screen Shot 5

The Future…

As Oracle moves forward to enhance the RESTful APIs, many doors continue to open for FDMEE and tool scheduling. At Edgewater Ranzal, we fully embrace the RESTful concept and evolve our solutions to utilize this functionality.  The result is improved support and flexibility of FDMEE and the future of Oracle Cloud products.

Contact us at info@ranzal.com with questions about this product or its capabilities.

Opening Ports for OAC - EM Browser Access and RPD Admin Tool Access [Two Minute Tutorial] @usanalytics @orclEPMblogs @orclEPMblogs @orclEPMblogs @orclEPMblogs

$
0
0

In this two-minute tutorial, I’ll show you how to open a port for Oracle Analytics Cloud (OAC) to get EM browser access as well as access to the RPD admin tool.

The steps in this tutorial are necessary for the subject of my upcoming blog post — three different methods for restarting OAC.

Essbase REST API - Part 4

$
0
0
On to Part 4 of this series looking at the Essbase REST API, which is currently only available in OAC. Just to recap, in the first part I provided an overview of the REST API, the second part was focused on application and database monitoring such as applications/database and properties, starting, stopping and deleting. In the last part I concentrated on management type tasks like managing substitution variables, filters and access permissions.

In this post I am going to cover scripts, listing, creating and editing. The examples will be based on calculation scripts, but the concept is the same for the other available types of scripts like MDX, Maxl and Report scripts. I will also look at running scripts through jobs and monitoring the status.

As usual I will stick with the same style examples using a mixture of a REST client and PowerShell, the choice is yours when it comes to scripting so pick the one that you feel most comfortable with.

You should be aware now that the URL structure to work with the REST API is:

https://<oac_essbase_instance>/rest/v1/{path}

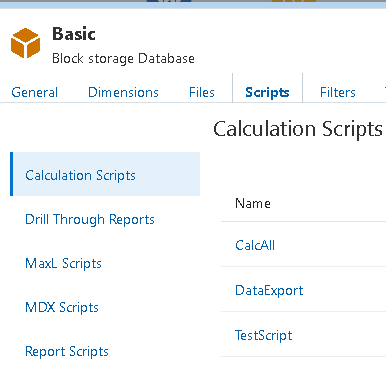
In the UI, the different type of scripts can be viewed at the database level.


To retrieve a list of calc scripts the URL format is:

https://<oac_essbase_instance>/rest/v1/applications/<appname>/databases/<dbname>/scripts

Just like with the other REST resources you can add the parameter “links=none” to suppress the links in the JSON that is returned.

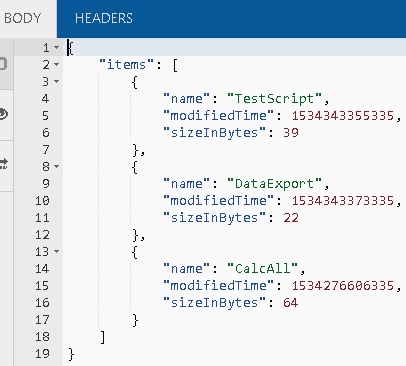
With a GET request against the following URL:

https://<oac_essbase_instance>/essbase/rest/v1/applications/Sample/databases/Basic/scripts?links=none

A list of available calc scripts for the Sample Basic database are returned in JSON format.


This matches what is displayed in the UI. If the “links=none” parameter is removed, then the links to the different resources are returned.


To view the content of a calc script, a GET request is made to the URL format of:

https://<oac_essbase_instance>/essbase/rest/v1/applications/<appname>/databases/<dbname>/scripts/<scriptname>/content

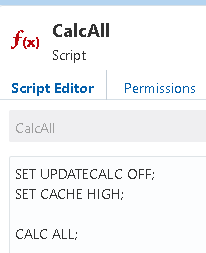
Let us take the “CalcAll” script in the Sample Basic application.


A GET request to

https://<oac_essbase_instance>/essbase/rest/v1/applications/Sample/databases/Basic/scripts/CalcAll/content


will return the contents in JSON format, the response will include “\n” for any new lines in the script.


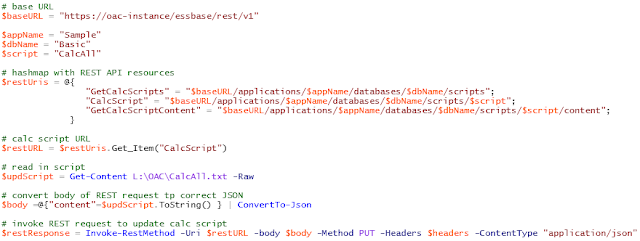
To edit a calc script, the content of the script is required in JSON format in the body of the request, the PUT method is required with the URL format.

https://<oac_essbase_instance>/essbase/rest/v1/applications/<appname>/databases/<dbname>/scripts/<scriptname>

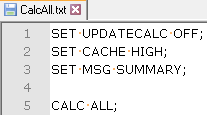
This time I am going to have a PowerShell script that reads in the following file:


Basically, it is the same calc all script with an additional SET command.

Once the script is read, it is converted to JSON and the REST request is made.


With a GET request, the content of the script can be outputted, and it now includes the changes.


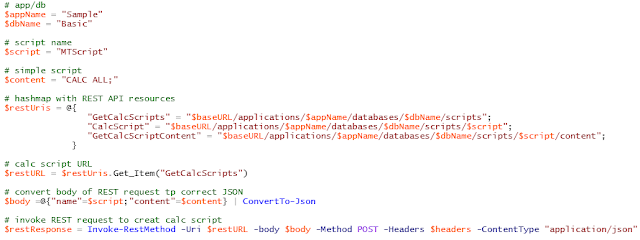
Creating a new calc script is very similar, a POST method request is made to the URL format:

https://<oac_essbase_instance>/essbase/rest/v1/applications/<appname>/databases/<dbname>/scripts

The body of the request must include the name of the script and the content in JSON.


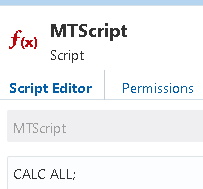
The following example creates a new script with one line of content.


In the UI the new script is available.


To delete a script the DELETE method is used against the URL format.

https://<oac_essbase_instance>/essbase/rest/v1/applications/<appname>/databases/<dbname>/scripts/<scriptname>

So that covers managing scripts, now on to running them, which is done through Jobs.


The following jobs can be run from the UI.


The list on the left is the available jobs in the user managed version of OAC and the right is autonomous OAC, the difference is that autonomous OAC does not include the ability to run MaxL and Groovy scripts.

As I have mentioned before, the majority of what you can do in the UI can also be achieved with REST.

To run a calculation script in the UI, you just select “Run Calculation” from the list of jobs.


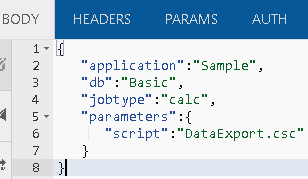
To run jobs with the REST API, a POST method request to the following URL format is required.

https://<oac_essbase_instance>/essbase/rest/v1/jobs

The body of the request includes the application, database, script name and job type.


Some of the other job types are maxl, mdxScript, groovy, dataload and dimbuild.

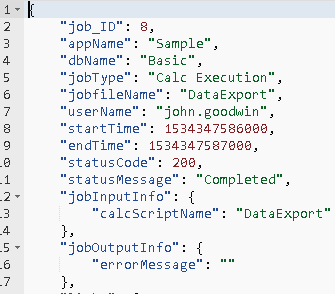
An example of the response from running a script is:


The response includes the current status of the job and a URL where you can keep checking the status.

https://<oac_essbase_instance>/essbase/rest/v1/jobs/<jobID>

Checking a job returns a similar response.


This is the equivalent of what would be displayed in the UI.


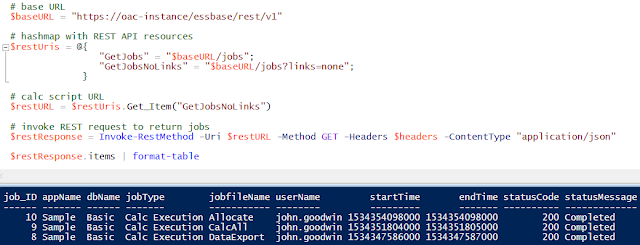
To replicate the list of jobs displayed in the UI with a script is an easy task.


As you can see, the start and end times are returned in Unix time format, these can be converted to a readable format with a simple function which I provided an example of in the second part of this series.


To run a job using a script can once again be achieved with very little code, the following example runs a calc script which creates a level0 export using the DATAEXPORT command.


You can either construct the URL to view job information with the job ID, or alternatively extract the URL from the response.


Now the status of the job can be repeatably checked until the status changes from “In progress”.


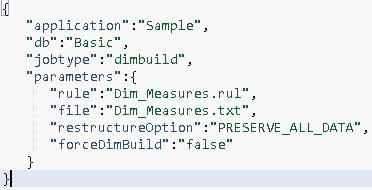
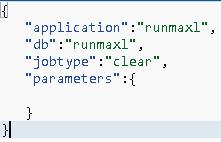
To run other job types only changes to the body of the request are required.

For example, to run an MDX script:


A data load:


A dimension build:


To clear all data from a database:


Anyway, back to the calc script I ran earlier, the data export in the script produces a level0 extract file named "level0.txt", this can be viewed in the UI.


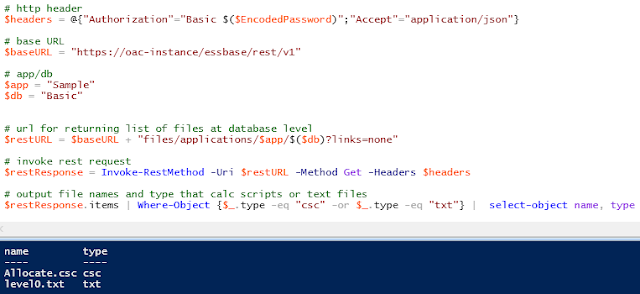
With the REST API, a list of files can be returned by making a GET request to the URL format:

https://<oac_essbase_instance>/essbase/rest/v1/files/applications/<appname>/<dbname>

To be able to list the files there is an additional header parameter required in the request, which is “Accept=application/json”

The following script returns all the calc script and text files in the Sample Basic database directory.


To download the file, the name of the file is required in the URL, the accept header parameter is not required.


The text file will then be available in the location specified in the script.


Another nice feature in OAC Essbase is the ability to view an audit trail of data either through the UI or Smart View.

To be able to do this a configuration setting “AUDITTRAIL” is required to be added at application level.


You will not be surprised to know that configuration settings can be added using the REST API with a post to the URL format:

https://<oac_essbase_instance>/essbase/rest/v1/files/applications/<appname>/configurations

The body should include the configuration setting name and value.


A http status code of 204 will be returned if the operation was successful.

If the application is started it will need restarting for the configuration to be applied, I went through stopping and starting applications in part 2 of this series.

Once the setting is in place, any data changes can be viewed in the UI at database level for the user logged in.


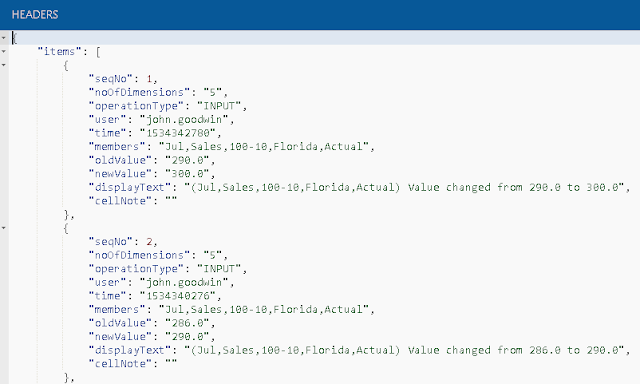
To return the audit data with the REST API then a GET method request can be made to the following URL format:

https://<oac_essbase_instance>/essbase/rest/v1/applications/<appname>/databases/<dbname>/audittrail/data


This will return the data in text format


To return the data in JSON format the accept header is required with “application/json”.


It doesn’t require much to replicate this functionality using scripting, the next example downloads the audit data to a CSV file.


The file can then be viewed in say Excel, the time will require updating to a readable format which can either be done in the script or Excel.


I am going to leave it here for this post, until next time….

ODTUG August News 2018


EPRCS Series: Cloning an EPRCS Instance @opal_epm @orclEPMblogs @orclEPMblogs @orclEPMblogs @orclEPMblogs @orclEPMblogs @orclEPMblogs @orclEPMblogs @orclEPMblogs @orclEPMblogs @orclEPMblogs @orclEPMblogs

$
0
0
Recently, I was faced with a situation where I needed to clone one EPRCS pod to another. This meant that I would effectively need to perform 2 migrations: Test to Test and Prod to Prod. Here was my end goal, illustrated: Regardless if you need to migrate from one instance to another instance within the … Continue reading EPRCS Series: Cloning an EPRCS Instance

Build a Homelab Dashboard: Part 8, FreeNAS

$
0
0

My posts seem to be getting a little further apart each week…  This week, we’ll continue our dashboard series by adding in some pretty graphs for FreeNAS.  Before we dive in, as always, we’ll look at the series so far:

  1. An Introduction
  2. Organizr
  3. Organizr Continued
  4. InfluxDB
  5. Telegraf Introduction
  6. Grafana Introduction
  7. pfSense
  8. FreeNAS

FreeNAS and InfluxDB

FreeNAS, as many of you know, is a very popular storage operating system.  It provides ZFS and a lot more.  It’s one of the most popular storage operating systems in the homelab community.  If you were so inclined, you could install Telegraf on FreeNAS.  There is a version available for FreeBSD and I’ve found a variety of sample configuration files and steps.  But…I could never really get them working properly.  Luckily, we don’t actually need to install anything in FreeNAS to get things working.  Why?  Because FreeNAS already has something built in:  CollectD.  CollectedD will send metrics directly to Graphite for analysis.  But wait…we haven’t touched Graphite at all in this series, have we?  No…but thanks to InfluxDB’s protocol support for Graphite.

Graphite and InfluxDB

To enable support for Graphite, we have to modify the InfluxDB configuration file.  But, before we get to that, we need to go ahead and create our new InfluxDB and provision a user.  If you take a look back at part 4 of this series, we cover this in more depth, so we’ll be quick about it now.  We’ll start by logging into InfluxDB via SSH:

influx -username influxadmin -password YourPassword

Now we will create the new database for our Graphite statistics and grant access to that database for our influx user:

CREATE DATABASE "GraphiteStats"
GRANT ALL ON "GraphiteStats" TO "influxuser"

And now we can modify our InfluxDB configuration:

sudo nano /etc/influxdb/influxdb.conf

Our modifications should look like this:

And here’s the code for those who like to copy and paste:

[[graphite]]
  # Determines whether the graphite endpoint is enabled.
  enabled = true
  database = "GraphiteStats"
  # retention-policy = ""
  bind-address = ":2003"
  protocol = "tcp"
  # consistency-level = "one"

Next we need to restart InfluxDB:

sudo systemctl restart influxdb

InfluxDB should be ready to receive data now.

Enabling FreeNAS Remote Monitoring

Log into your FreeNAS via the web and click on the Advanced tab:

Now we simply check the box that reports CPU utilization as a percent and enter either the FQDN or IP address of our InfluxDB server and click Save:

Once the save has completed, FreeNAS should start logging to your InfluxDB database.  Now we can start visualizing things with Grafana!

FreeNAS and Grafana

Adding the Data Source

Before we can start to look at all of our statistics, we need to set up our new data source in Grafana.  In Grafana, hover over the settings icon on the left menu and click on data sources:

Next click the Add Data Source button and enter the name, database type, URL, database name, username, and password and click Save & Test:

Assuming everything went well, you should see this:

Finally…we can start putting together some graphs.

CPU Usage

We’ll start with something basic, like CPU usage.  Because we checked the percentage box while configuring FreeNAS, this should be pretty straight forward.  We’ll create a new dashboard and graph and start off by selecting our new data source and then clicking Select Measurement:

The good news is that we are starting with our aggregate CPU usage.  The bad news is that this list is HUGE.  So huge in fact that it doesn’t even fit in the box.  This means as we look for things beyond our initial CPU piece, we have to search to find them.  Fun…  But let’s get start by adding all five of our CPU average metrics to our graph:

We also need to adjust our Axis settings to match up with our data:

Now we just need to set up our legend.  This is optional, but I really like the table look:

Finally, we’ll make sure that we have a nice name for our graph:

This should leave us with a nice looking CPU graph like this:

Memory Usage

Next up, we have memory usage.  This time we have to search for our metric, because as I mentioned, the list is too long to fit:

We’ll add all of the memory metrics until it looks something like this:

As with our CPU Usage, we’ll adjust our Axis settings.  This time we need to change the Unit to bytes from the IEC menu and enter a range.  Our range will not be a simple 0 to 100 this time.  This time we set the range from 0 to the amount of ram in your system in bytes.  So…if you have 256GB of RAM, its 256*1024*1024*1024 (274877906944):

And our legend:

Finally a name:

And here’s what we get at the end:

Network Utilization

Now that we have covered CPU and Memory, we can move on to network!  Network is slightly more complex, so we get to use the math function!  Let’s start with our new graph and search for out network interface.  In my case this is ix1, my main 10Gb interface:

Once we add that, we’ll notice that the numbers aren’t quite right.  This is because FreeNAS is reporting the number is octets.  Now, technically an octet should be 8 bits, which is normally a byte.  But, in this instance, it is reporting it as a single bit of the octet.  So, we need to multiply the number by 8 to arrive at an accurate number.  We use the math function with *8 as our value.  We can also add our rx value while we are at it:

Now are math should look good and the numbers should match the FreeNAS networking reports.  We need to change our Axis settings to bytes per second:

And we need our table (again optional if you aren’t interested):

And finally a nice name for our network graph:

Disk Usage

Disk usage is a bit tricky in FreeNAS.  Why?  A few reasons actually.  One issue is the way that FreeNAS reports usage.  For instance, if I have a volume that has a data set, and that data set has multiple shares, free disk space is reported the same for each share.  Or, even worse, if I have a volume with multiple data sets and volumes, the free space may be reporting correctly for some, but not for others.  Here’s my storage configuration for one of my volumes:

Let’s start by looking at each of these in Grafana so that we can see what the numbers tell us.  For ISO, we see the following options:

So far, this looks great, my ISO dataset has free, reserved, and used metrics.  Let’s look at the numbers and compare them to the above.  We’ll start by looking at df_complex-free using the bytes (from the IEC menu) for our units:

Perfect!  This matches our available number from FreeNAS.  Now let’s check out df_complex-used:

Again perfect!  This matches our used numbers exactly.  So far, we are in good shape.  This is true for ISO, TestCIFSShare, and TestNFS which are all datasets.  The problem is that TestiSCSI and WindowsiSCSI don’t show up at all.  These are all zVols.  So apparently, zVols are not reported by FreeNAS for remote monitoring from what I can tell.  I’m hoping I’m just doing something wrong, but I’ve looked everywhere and I can’t find any stats for a zVol.

Let’s assume for a moment that we just wanted to see the aggregate of all of our datasets on a given volume.  Well..that doesn’t work either.  Why?  Two reasons.  First, in Grafana (and InfluxDB), I can’t add metrics together.  That’s a bit of a pain, but surely there’s an aggregate value.  So I looked at the value for df_complex-used for my z8x2TB dataset, and I get this:

Clearly 26.4 MB does not equal 470.6GB.  So now what?  Great question…if anyone has any ideas, let me know, as I’d happily update this post with better information and give credit to anyone that can provide it!  In the meantime, we’ll use a different share that only has a single dataset, so that we can avoid this annoying math and reporting issues.  My Veeam backup share is a volume with a single dataset.  Let’s start by creating a singlestat and pulling in this metric:

This should give us the amount of free storage available in bytes.  This is likely a giant number.  Copy and paste that number somewhere (I chose Excel).  My number is 4651271147041.  Now we can switch to our used number:

For me, this is an even bigger number: 11818579150671, which I will also copy and paste into Excel.  Now I will do simple match to add the two together which gives a total of 16469850297712.  So why did we go through that exercise in basic math?  Because Grafana and InfluxDB won’t do it for us…that’s why.  Now we can turn our singlestat into a gauge.  We’ll start with our used storage number from above.  Now we need to change our options:

We start by checking the Show Gauge button and leave the min set to 0 and change our max to the value we calculated as our total space, which in my case is 16469850297712.  We can also set thresholds.  I set my thresholds to 80% and 90%.  To do this, I took my 16469850297712 and multiplied by .8 and .9.  I put these two numbers together, separated by a comma and put it in for thresholds: 13175880238169.60,14822865267940.80.  Finally I change the unit to bytes from the IEC menu.  The final result should look like that:

Now we can see how close we are to our max along with thresholds on a nice gauge.

CPU Temperature

Now that we have the basics covered (CPU, RAM, Network, and Storage), we can move on to CPU temperatures.  While we will cover temps later in an IPMI post, not everyone running FreeNAS will have the luxury of IPMI.  So..we’ll take what FreeNAS gives us.  If we search our metrics for temp, we’ll find that every thread of every core has its own metric.  Now, I really don’t have a desire to see every single core, so I chose to pick the first and last core (0 and 31 for me):

The numbers will come back pretty high, as they are in kelvin and multiplied by 10.  So, we’ll use our handy math function again (/10-273.15) and we should get something like this:

Next we’ll adjust our Axis to use Celsius for our unit and adjust the min and max to go from 35 to 60:

And because I like my table:

At the end, we should get something like this:

Conclusion

In the end, my dashboard looks like this:

This post took quite a bit more time than any of my previous posts in the series.  I had built my FreeNAS dashboard previously, so I wasn’t expecting it to be a long, drawn out post.  But, I felt as I was going through that more explanation was warranted and as such I ended up with a pretty long post.  I welcome any feedback for making this post better, as I’m sure I’m not doing the best way…just my way.  Until next time…

The post Build a Homelab Dashboard: Part 8, FreeNAS appeared first on EPM Marshall.

Three Methods for Restarting OAC

Quick Tip - Oracle Smart View disable for Outlook

$
0
0
Had an instance where one of the customers had installed the Oracle SmartView for accessing the Oracle Planning and Budgeting Cloud. After the installation, the Microsoft Outlook didn’t get started and was staying in the screen starting for a quite long time.

This was quite annoying, but luckily there is an easy solution to the issue. There is life saver option given in SmartView under Options -> Advanced.


With this option, Smart view will be disabled in Outlook and will not hamper the time to load the Outlook. Hope this helps.


How to Travel

$
0
0

This summer I did something that I've thought about for a while. I wrote a (Amazon) Kindle book on traveling for business. But not about the best restaurants or hotels or best ways to maximize frequent flyer points, but more about the logistics of business travel. How to make life work and efficient and sane when you're away from home every week. That includes not only managing your life while you're getting through airports and hotels but how to get things done at home too. 

In this book I share many of my experiences along with others I've worked with. Nothing like this was available when I started traveling for work, so hopefully it helps others that are starting out.

Here's the link to the book on Amazon. Note that you don't need a Kindle to read it, as they have mobile and tablet apps or it can be read online.


Viewing all 1880 articles
Browse latest View live